➕ 8th Grade Math · Unit 8
Bivariate Data
14 short narrated lessons in 3 chapters, each with pictures, a quiz with a hint and a second try, and an explanation for every answer.
Standards: 8.SP.A.1 8.SP.A.2 8.SP.A.3 8.SP.A.4



What your child will learn
Scatter plots
- Making Scatter PlotsMake a scatter plot from paired data.
- Patterns of AssociationDescribe positive, negative or no association, and linear or nonlinear patterns in a scatter plot.
- Clusters and OutliersIdentify clusters and outliers in a scatter plot and explain what they might mean.
- Fitting a LineDraw a line of best fit and judge how closely the data points follow it.
- Scatter Plots Review ReviewReview making scatter plots, describing association and fitting a line.
Linear models for data
- Writing the Equation of a Trend LineWrite the equation of a trend line using two points on it.
- What Slope and Intercept MeanExplain what the slope and intercept of a trend line mean in the data's context.
- Making Predictions with a Trend LineUse a trend line equation to predict values and judge how reliable the prediction is.
- Linear Models for Data: Review ReviewReview writing trend line equations, interpreting slope and intercept and making predictions.
Two-way tables
- Reading Two-Way TablesRead and build a two-way table that shows counts for two categories.
- Relative FrequenciesFind row and column relative frequencies in a two-way table.
- Finding Association in Two-Way TablesUse relative frequencies to decide whether two categories are associated.
- Two-Way Tables Review ReviewReview two-way tables, relative frequencies and finding association in categorical data.
- Unit 8 Test: Bivariate DataShow what you learned in the whole unit (Scatter plots, Linear models for data, Two-way tables) by answering mixed questions.
Try a question from this unit
From the lesson “Making Scatter Plots”
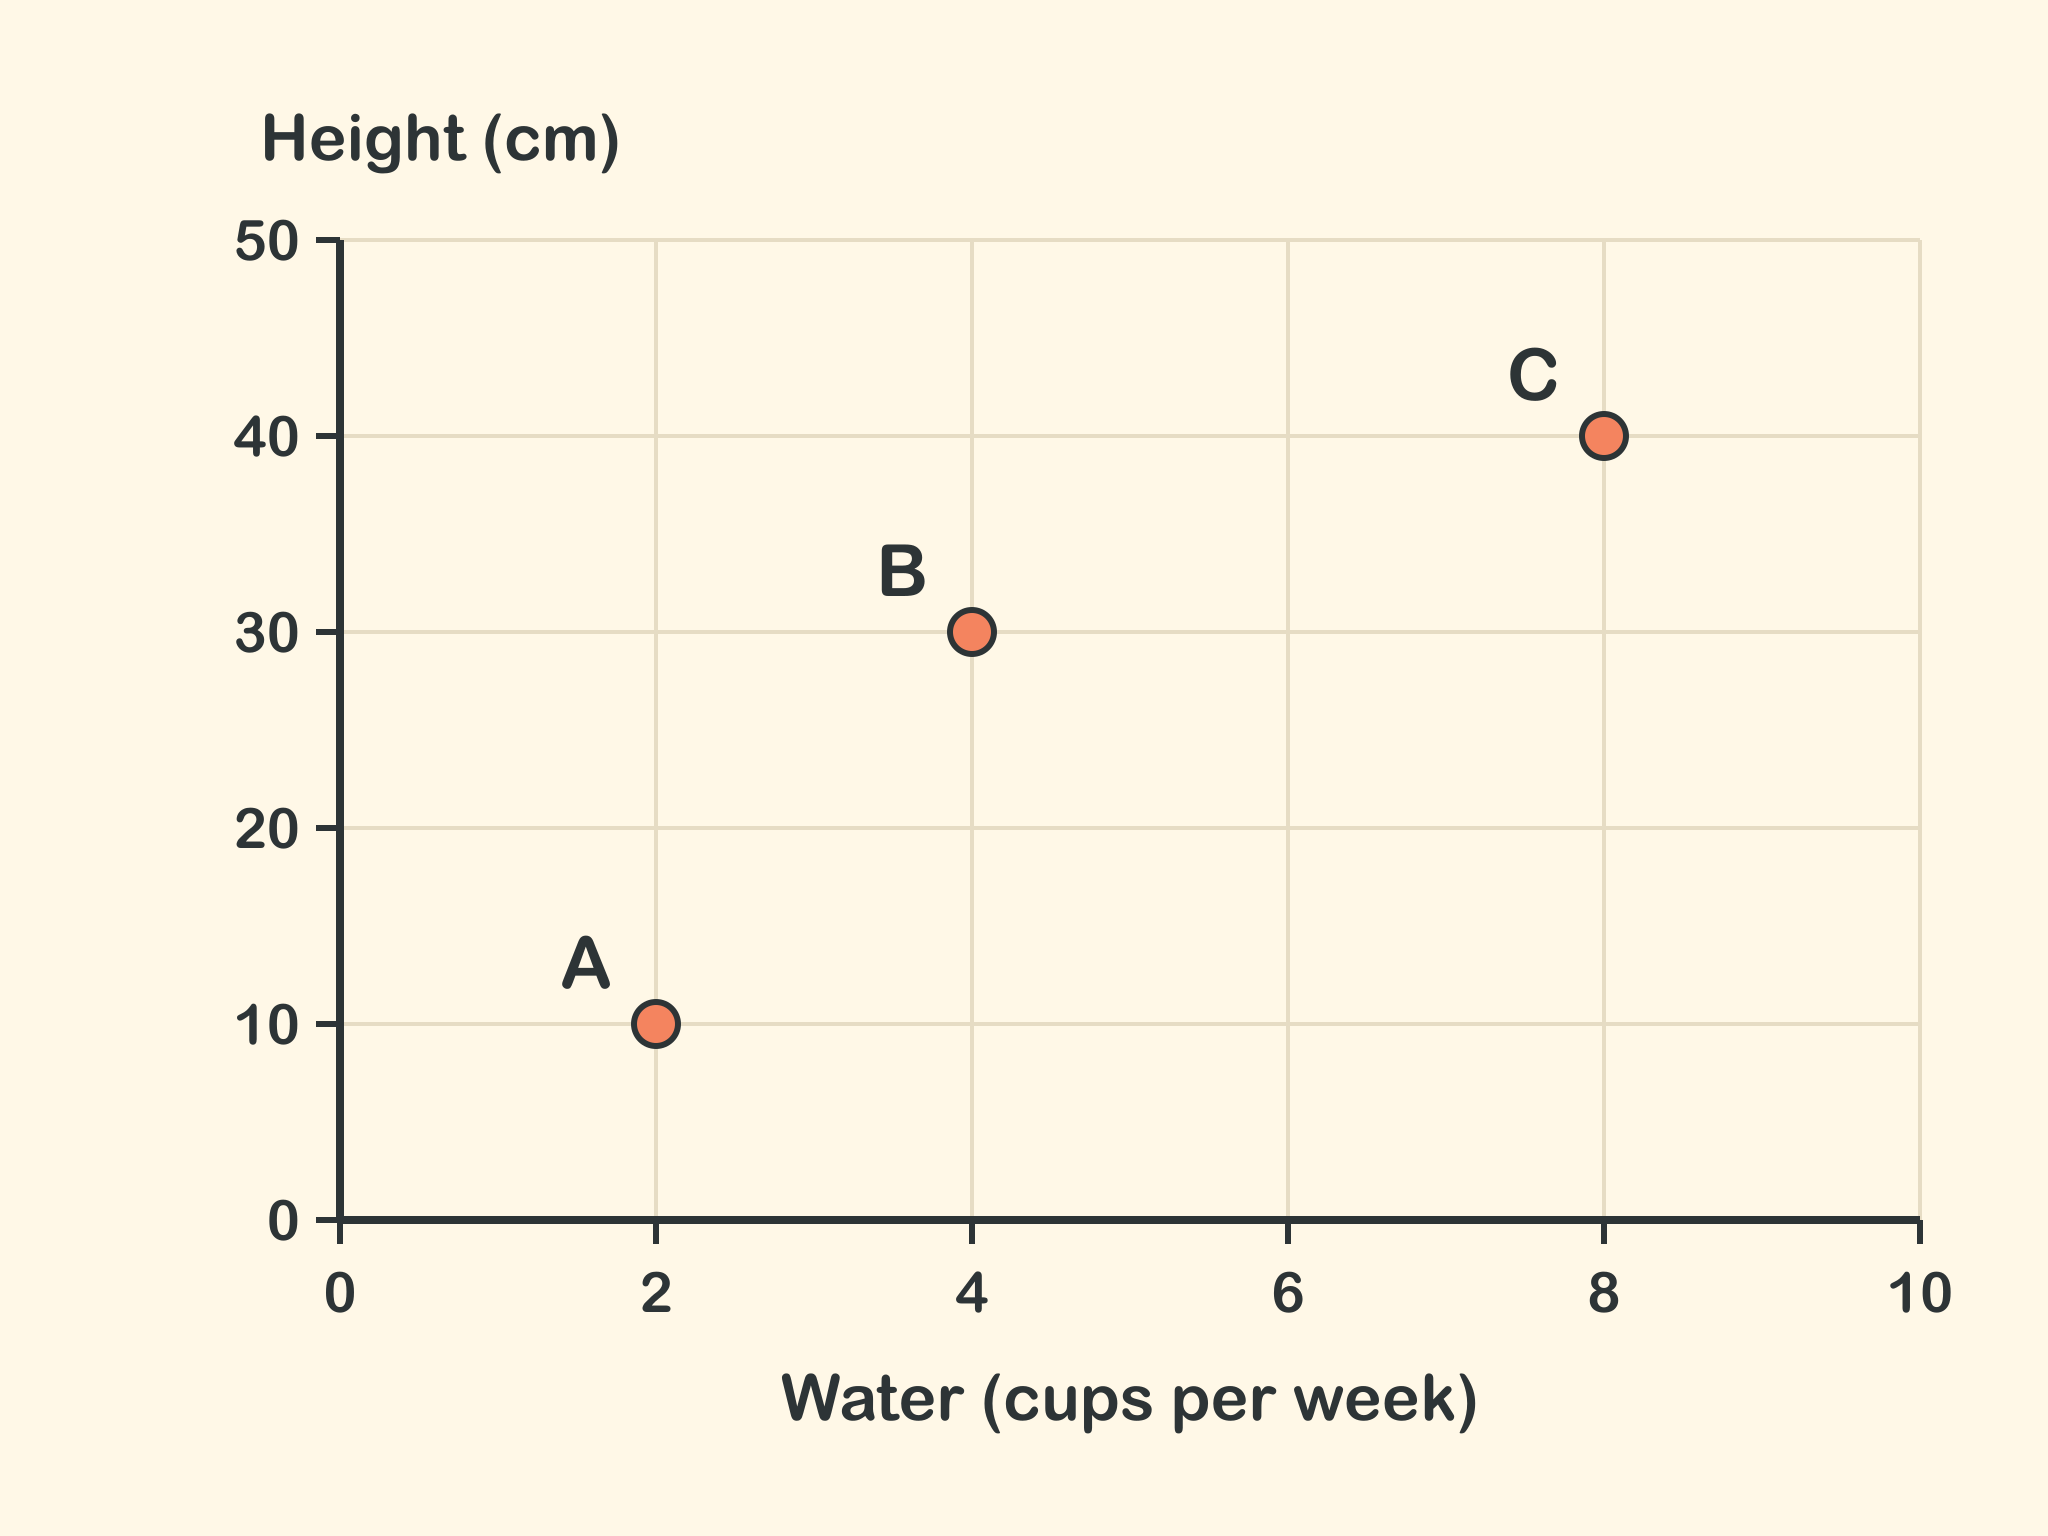
This scatter plot shows example data for a few plants. Which pair does point B show?
Show the answer
(4, 30). Point B sits above 4 on the x-axis and level with 30 on the y-axis, so it is (4, 30). The pair (30, 4) swaps the order, but the x-value always comes first.
Hint kids see after a wrong try: “Read straight down from the point to the x-axis first, then straight across to the y-axis.”
Key words
- scatter plot
- bivariate data
- association
- positive
- negative
- cluster
- outlier
- line of best fit
- trend line
- equation
- slope
- intercept
- prediction
- two-way table
- categorical data
- relative frequency
Try these lessons in Kids Shelf
Narrated lessons, pictures and quizzes for every grade from K to 8. Works offline.