➕ 2nd Grade Math · Unit 7
Data and Graphs
5 short narrated lessons in 1 chapter, each with pictures, a quiz with a hint and a second try, and an explanation for every answer.
Standards: 2.MD.D.9 2.MD.D.10


What your child will learn
Graphs and line plots
- Line PlotsMeasure several objects and show the lengths on a line plot.
- Picture GraphsMake and read a picture graph with up to four categories.
- Bar GraphsMake and read a bar graph with up to four categories.
- Solving Problems with GraphsUse a graph to solve put-together, take-apart and compare problems.
- Graphs and Line Plots Review ReviewReview line plots, picture graphs and bar graphs.
Try a question from this unit
From the lesson “Line Plots”
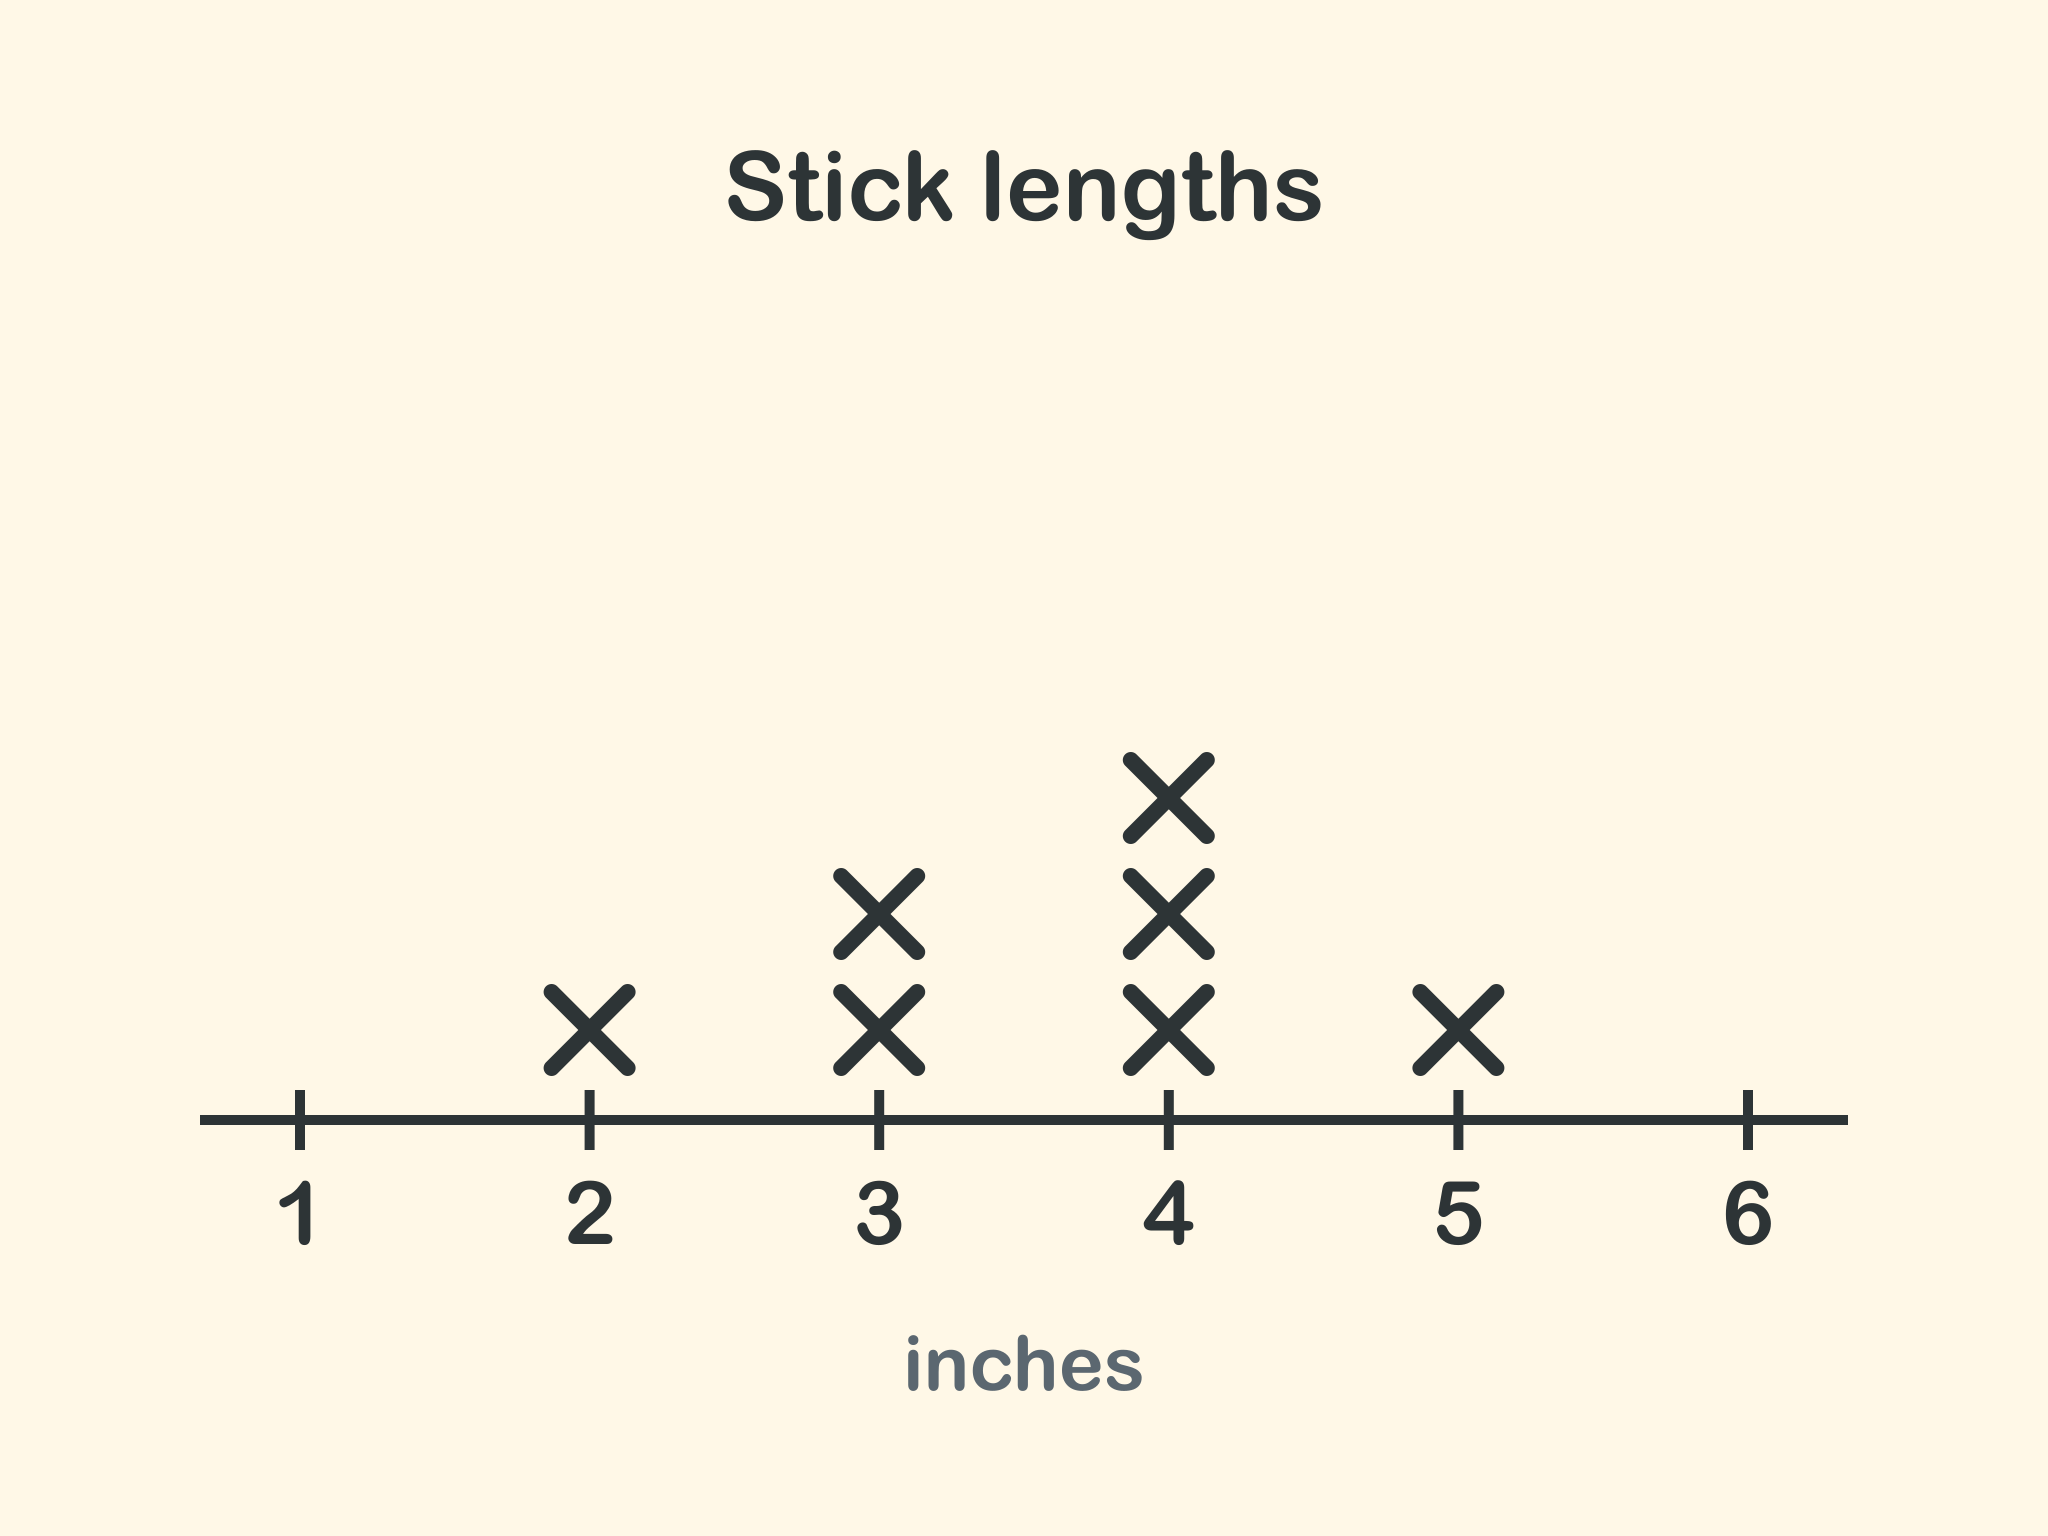
This line plot shows how long some sticks are. How many sticks are 4 inches long?
Show the answer
[object Object]. There are 3 X marks above 4, so 3 sticks are 4 inches long.
Hint kids see after a wrong try: “Find 4 on the line. Count the X marks above it.”
Key words
- line plot
- picture graph
- bar graph
- compare
Try these lessons in Kids Shelf
Narrated lessons, pictures and quizzes for every grade from K to 8. Works offline.